[ 36 ]
SERVIZIO INDICATORI PERSONALI HEALTH SEARCH
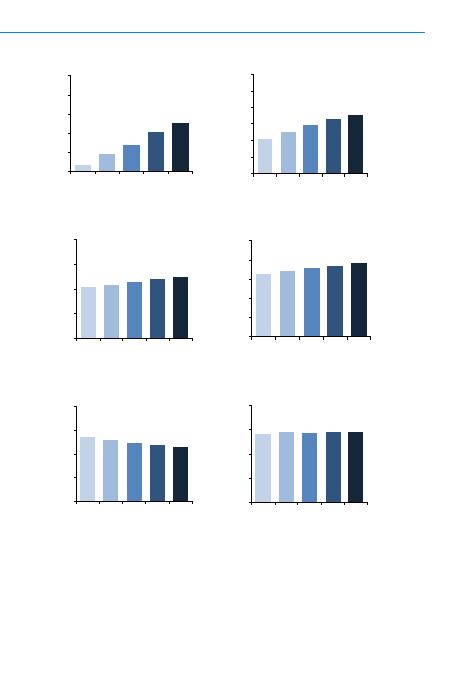
Figura 3.7a Area cardiovascolare: indicatori di processo (anni 2005 - 2009)
Figura 3.7a Area cardiovascolare: indicatori di processo (anni 2005 - 2009)
0.7
1.8
2.8
4.1
5.0
0
2
4
6
8
10
2005 2006 2007 2008 2009
(
%
)
PCV1
20.7
25.2
29.5
33.0 35.3
0
10
20
30
40
50
60
2005 2006 2007 2008 2009
(
%
)
PCV2
20.7 21.9
23.0 24.0 24.7
0
10
20
30
40
2005 2006 2007 2008 2009
(
%
)
IPERTENSIONE1
65.2 68.6
71.7 73.8 76.1
0
20
40
60
80
100
2005 2006 2007 2008 2009
(
%
)
IPERTENSIONE2
54.5 51.9
48.9 47.4 45.6
0
20
40
60
80
2005 2006 2007 2008 2009
(
%
)
IPERTENSIONE3
56.2 57.6 56.8 57.3 57.2
0
20
40
60
80
2005 2006 2007 2008 2009
(
%
)
IPERTENSIONE5