[ 27 ]
SERVIZIO INDICATORI PERSONALI HEALTH SEARCH
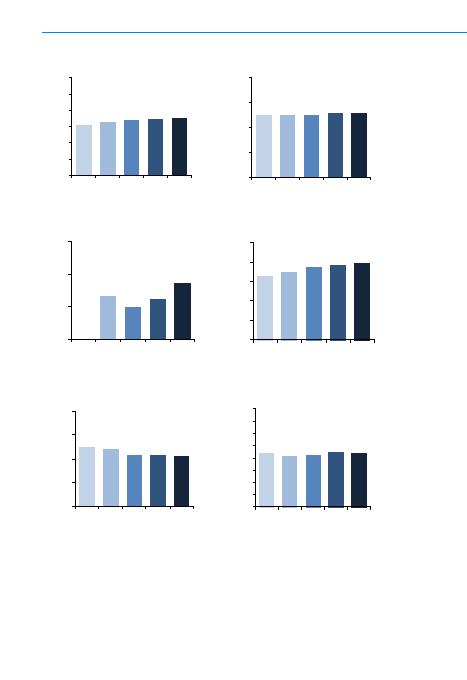
Figura 3.5a Area Pneumologica: indicatori di processo (anni 2005 - 2009)
Figura 3.5a Area Pneumologica: indicatori di processo (anni 2005 - 2009)
3.1
3.3
3.4
3.4
3.5
0
1
2
3
4
5
6
2005 2006 2007 2008 2009
(
%
)
BPCO1
50.0 50.0 50.0 51.1 51.1
0
20
40
60
80
2005 2006 2007 2008 2009
(
%
)
BPCO2
0.0
6.7
5.0
6.3
8.7
0
5
10
15
2005 2006 2007 2008 2009
(
%
)
BPCO3
66.0 70.1
75.0 76.9 79.5
0
20
40
60
80
100
2005
2006
2007
2008
2009
(
%
)
BPCO4
50.0 48.0
42.9 42.9 42.2
0
20
40
60
80
2005 2006 2007 2008 2009
(
%
)
BPCO5
21.7 20.8 21.1 22.4 21.9
0
5
10
15
20
25
30
35
40
2005 2006 2007 2008 2009
(
%
)
BPCO6